
Authors: Alan Wight and Karima Samadi
This article is based on a forthcoming publication in the Agriculture Education Magazine. http://www.naae.org/profdevelopment/magazine/
Hello NATI,
Good to see you friend. How are things? So, the local food scene has caught your attention. You have heard people talking about food maps and you want to learn more? Nice!
First lets talk about why Food Mapping is important. This exercise helps participants understand their local food webs, or food environment. Maps are tools, baselines that can show improvements over time on a wide array of issues including areas in need and areas of privilege. Food mapping tells a story of how the physical environment intersects with the lived experience of food access. Participatory mapping engages eaters and generates local knowledge that increases people’s awareness regarding where food comes from, how it is produced, distributed, and sold. Food Mapping strengthens and establishes new social and economic links between different components of the food web. It can highlight land use (fruit trees, community gardens, etc.) and identify the possibilities for current and future projects. It can also locate “food deserts” or “food swamps” and highlight the supports and barriers to healthy food availability and access. Food Mapping creates transparent, abundant data that can show relationships between community organizations, businesses, and farmers.
Well, where should we start? What are you interested in mapping? There are many kinds of Food and Community Asset Maps. You can map your own living area, like a kitchen, cupboard, outside greenspace, or a friendly neighbors’ yards. You can also map community gardens, wild edibles, restaurants, grocery stores, farmer’s markets, commercial kitchens, and much more.
We like to frame Food Mapping as an asset-based process of developing a picture of the food sources and resources in a certain area. By placing these items on a map, we begin to understand our relationship to the food environment. Food Mapping is a fun, family friendly activity that engages the community, city, and region in creative place-making and local foodshed improvements. On a macro scale, community food mapping can even help create a food council/taskforce who can use the food map as evidence for change needed in the community. In communities around the nation, this has been a gateway to community conversation, and grassroots action, which can have ripple effects on policy, systems, and environment change. Often, the best thing to do is go for a walk. Find a friend, talk about what you want to map, and then go get a little exercise. You can also plan events for after the walk such as community meals with arts and crafts (map making), street poetry, and/or some live music.
To help you get a sense of what we talking about, here are some examples of food maps, most of which are local - presented from the simple to the more complex. You can click on the most of the pictures to learn more about each project. Next, we have provided you with some basic mapping instructions and references. Then there are links to several different kinds of Food Mapping Toolkits that already been developed over the years to assist educators, health advocates, and community organizers with this process. Finally, we have also listed mobile applications that you can use to collect information and create maps of your own.
Food Mapping Examples:
1. Albon Eco Food Map
Deborah Albon creates eco-maps related to food, where participants explore their own food intake. This kind of map is great for younger children and can serve as a parental and family engagement tool to encourage healthy eating habits. The lines represent frequency regarding food, person, and place. The dark solid lines means the relationship occurs daily or more than once per week. The thinner solid line means the relationship occurs once per week. The dotted line means the relationship occurs once a month.

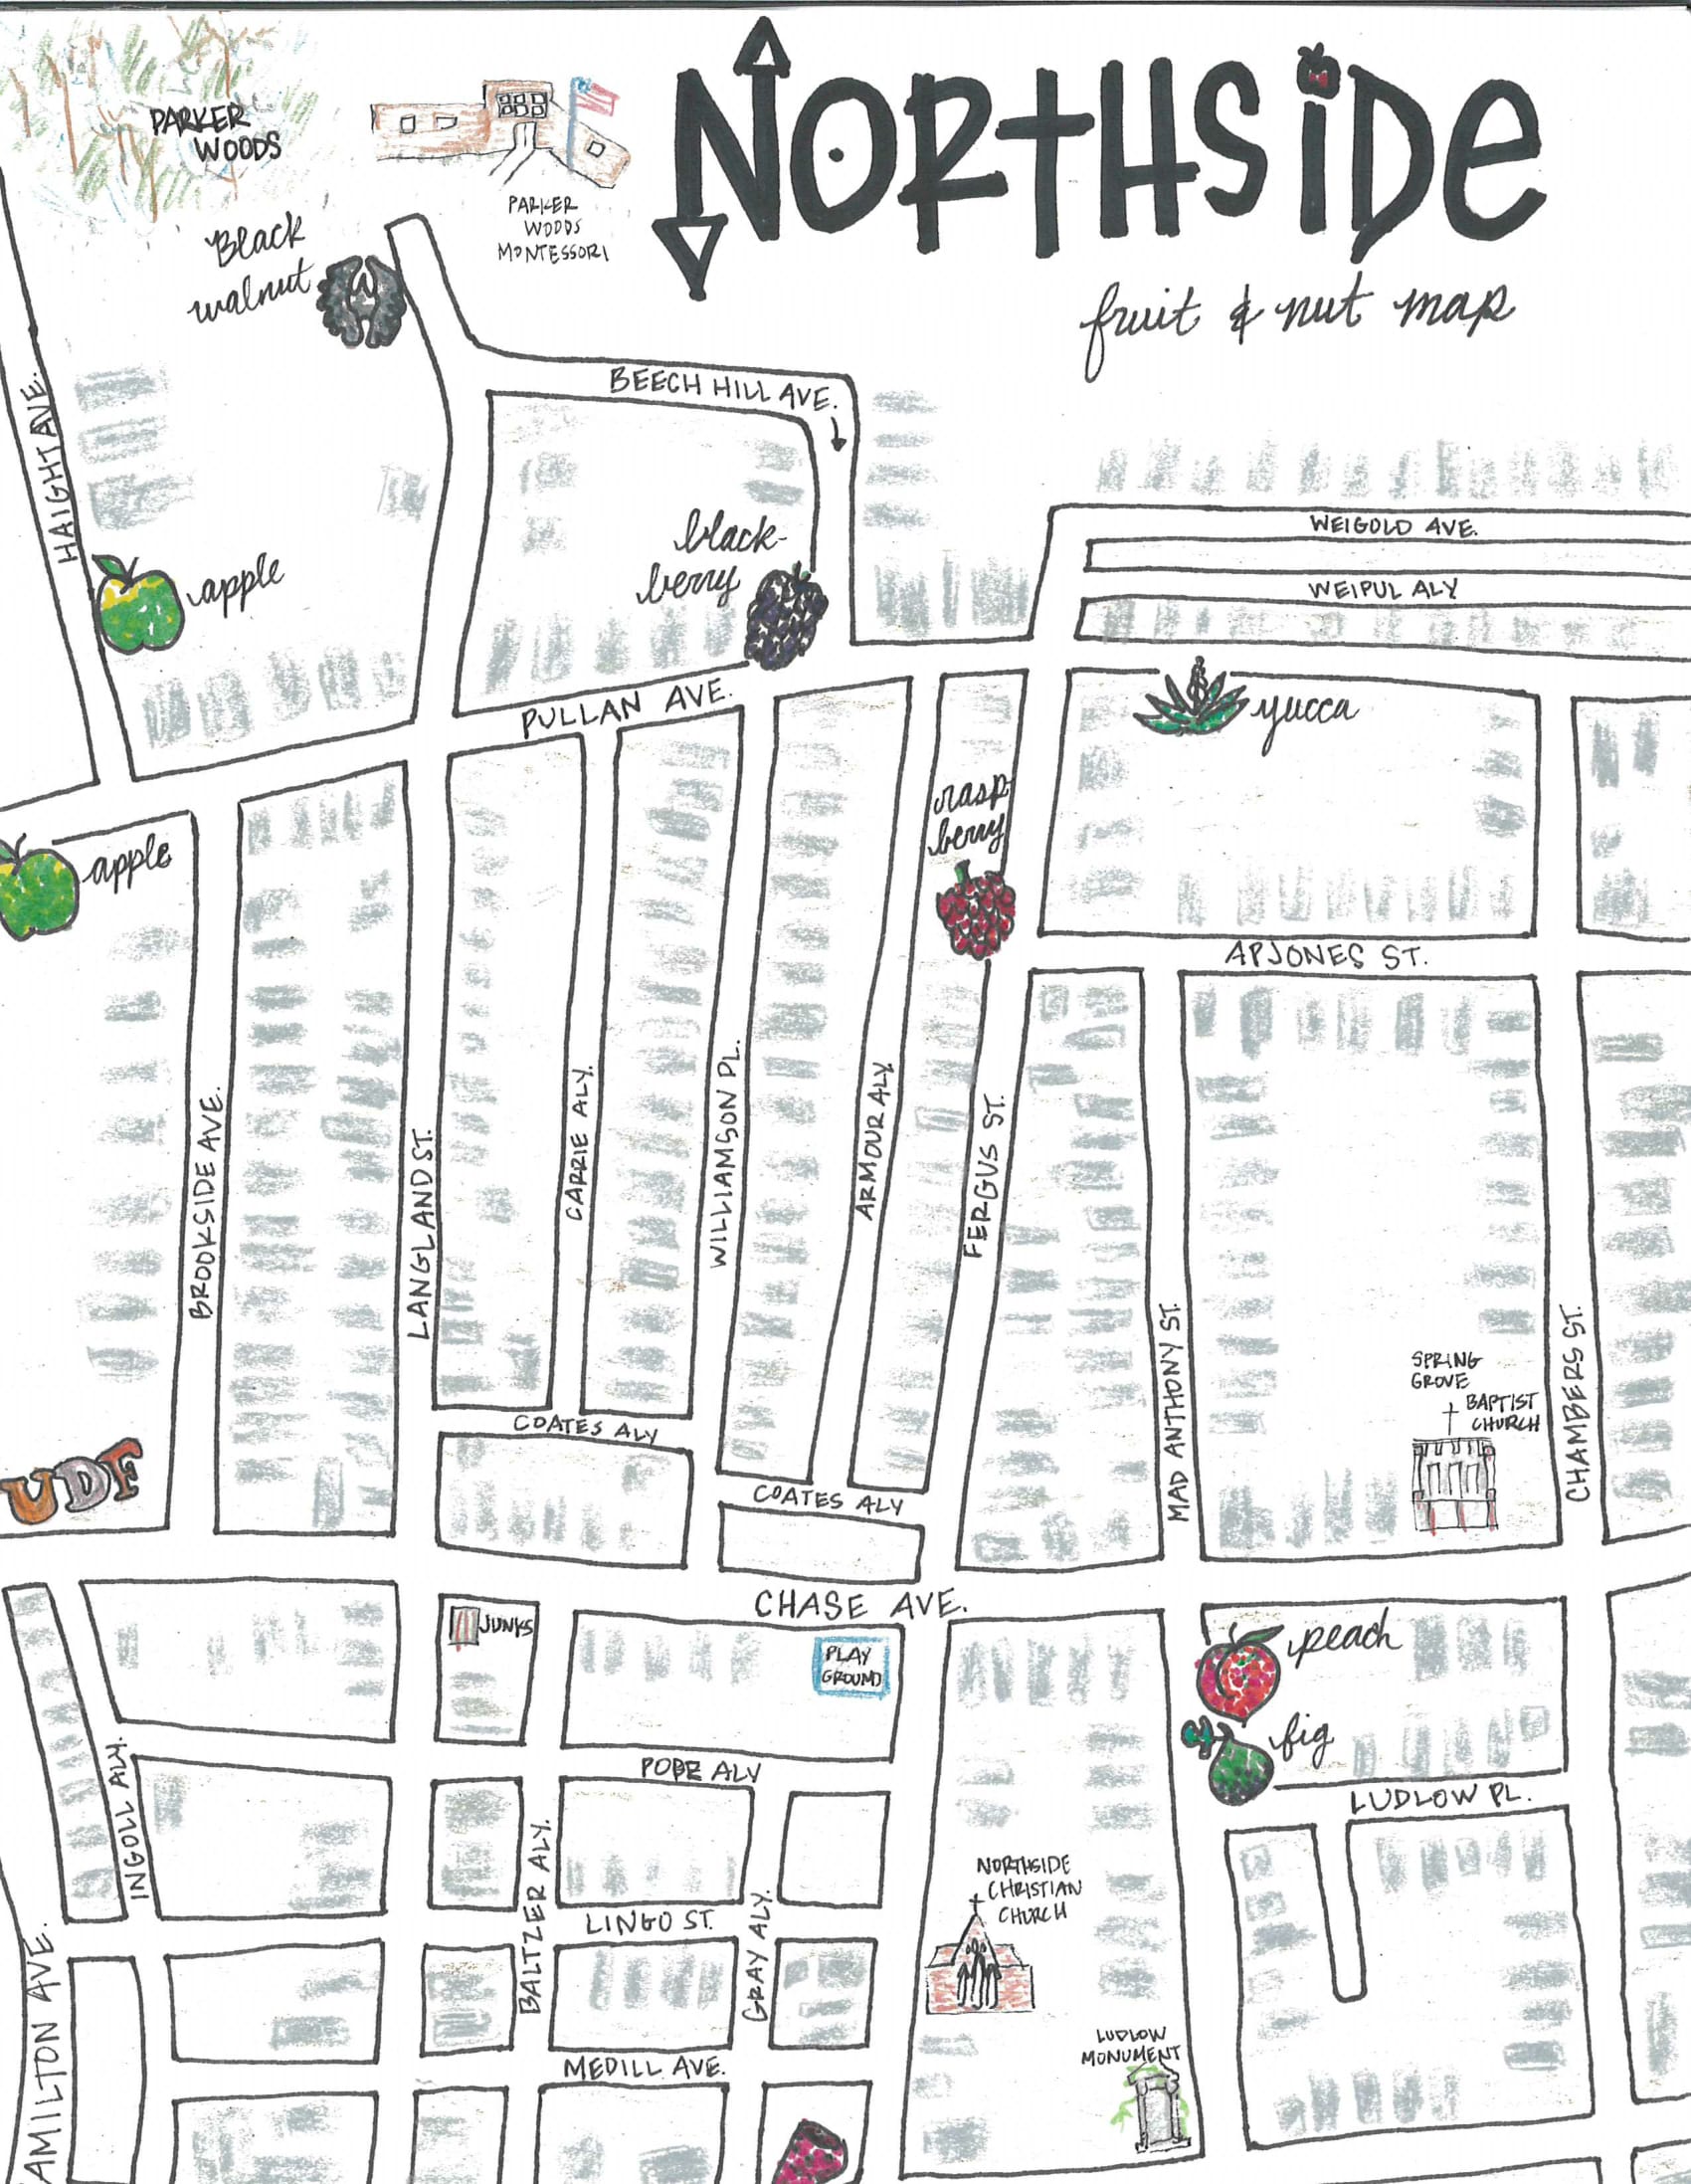
2. Northside Food Map Rose CSCTC
This map was made by Rose, a Cincinnati State Community and Technical College student, who walked the streets of Northside documenting the wild edibles for her Fruit and Nut Production Class.
3. Northside Fruit Park
Similar to the last example, A Northside Fruit Park displays a larger portion of the neighborhood, highlighting 13 different kinds of edibles. This map was sponsored by Urban Artifact, CAIN, Shake it Records, Northside Village Green, Cincinnati Permaculture Institute, Groundwork Cincinnati, Cincinnati State Community and Technical College, Central Ohio River Valley Local Food Guide, Far-I-Rome Production, Green Umbrella, and UC’s College of Education, Criminal Justice, Human Services and Information Technology. If you like this, also consider collecting and then uploading information to websites like Falling Fruit (https://fallingfruit.org/) – where the location of wild edibles are recorded all over the world.

4. CAMP Map
The Camp Washington Art and Mobile Produce (CAMP) Project was funded through an Engage Cincy Grant. The CAMP is a mobile piece of art that provides fresh produce to families from their Urban Farm and offers make-it-take-it arts and crafts activities related to food awareness and education. The CAMP cart also hands out a Food Map of Camp Washington, which identiofies grocery and convenience stores, restaurants and fast food establishments, community and school gardens, meat processing and packaging facilities, and food pantries. This map also highlights edible fruit and nut trees such as mulberries, peaches, apples, and black walnuts, as well as community assets—The Camp Washington Urban Farm, the Salt Dome, community centers, and cultural and artistic centers (The Swing House, Wave Pool, and the American Sign Museum).

5. Covington’s Westside Community Asset and Food Map
Covington’s Westside Community Asset and Food Map was inspired and created by conversations with residents. The Center for Great Neighborhoods hosted a series of Food Mapping Workshops and community dialogue events to assess their food related assets and dream of what Covington may become. Community artists designed the icons. In addition to this map, the Center also created an “Envision Map” that hangs in their lobby and invites residents to stop in and share their ideas. This project was part of a lager FreshLo Grant funded by the Kresge Foundation.

6. Green Umbrella Map
The Green Umbrella’s, Local Food Advocate, Marian Dickenson, used the Google Map Platform to create zoomable layers that show farms, farmer markets (including those that accept EBT/SNAP), community supported agriculture programs and herd share pick ups, restaurants and stores sourcing local food products, wineries, distilleries, breweries, and community gardens.

7. West Chester, Ohio
This is interactive story map shows the routes, pictures, and video interpretations of the participants who helped to create this story map. Working with Ohio State University, the team used the Healthy Eating Active Living: Mapping Attributes using Participatory Photographic Surveys (or HEAL MAPPS) process for this project.

If you like what you have seen here, consider making some maps of your own. Here are some basic suggestions for materials and protocols.
Materials:
- Blank paper for notes and drawing map routes
- Clipboards
- Pencils
- Walking shoes
- Smart phones (for pictures, videos, and map apps)
- Base/Blank map of the area
- Data collection sheets (depending on the purpose)
- Compass (optional)
Steps:
- Find some people and decide what to map. Team up with community members, take a walk around the neighborhood, talk to other people, and search and visit different types of food locations, sources, and assets.
Community assets can be murals, people, libraries, churches, community centers, gyms, bike paths, public and commercial kitchens, public spaces, green spaces, businesses, etc.
If you are interested in the healthy eating and active living environment, consider documenting aspects of the physical space (parks, sidewalks, convenient/corner stores). Which ones are supports or barriers to wellness?
- Food locations can be a fast food retailer, restaurant, grocery store, garden, gas station convenience store, corner store, vending machine, wild edibles, plant nurseries or any place where ‘food’ is available. Draw as you go. Map a map. Take notes, pictures, record the nearest address/landmarks, and details regarding the food source/resource.
- Once you have walked for a few hours (or done this a few times with friends), plan a conversation to discuss what you will make. You can make a mural, large map, group maps, or individual maps. The information and maps are collected, transcribed, and translated into digital maps or applications. This part can take a long time and stable leadership and commitment are required at times.
- Once your maps and other products are done, you should then share them with your community of practice and community members for feedback and further edits. Once everyone is comfortable with the products, decide what additional actions steps you will take to create an agro-ecological-sustainable food system.
In addition to our simplified steps above, take your own tour of the wonderful Food Mapping guides that have already been created!
Tool kit list:
- Making Links: A Toolkit for Local Food Projects. From: Sustain, the alliance for better food and farming. https://www.sustainweb.org/publications/making_links_a_toolkit/
- Community food security assessment toolkit. From: Barbara Cohen, IQ Solutions, Inc. United States Department of Agriculture. http://www.sustainablecitiesinstitute.org/Documents/SCI/Report_Guide/Guide_USDA_CommFoodSecurityAssessmentToolkit.pdf
- Putting food access on the radar: how to target and prioritise communities at risk. National Consumer Council, London. From: O’Neill, M. https://www.oxfordshire.gov.uk/cms/sites/default/files/folders/documents/roadsandtransport/transportpoliciesandplans/localtransportplan/ltp2/ltpaccessibilitystrategyB.pdf
- Healthy Eating Active Lifestyles: Mapping Attributes using Participatory Photographic Surveys. From: Oregon State University, Grow Healthy Kids Community - HEAL MAPPSTM : http://extension.oregonstate.edu/growhkc/sites/default/files/heal-mapps-manual-preview.pdf
- Mapping Local Food Webs Toolkit. From: Campaign to Protect Rural England and Messer & Barratt: http://www.cpre.org.uk/resources/farming-and-food/local-foods/item/3076-mapping-local-food-webs-toolkit
- A Food Mapping Tool-Kit: How to Organize a Workshop in your Community. From: Our Food Our Health Our Culture, and Food Mapping Manitoba. http://www.foodmattersmanitoba.ca/wp-content/uploads/2014/04/Food-Mapping-tool-kit.pdf
- Food Mapping: a psychogeographic method for raising food consciousness. From Wight & Killham. http://www.tandfonline.com/doi/full/10.1080/03098265.2014.900744
If you are interested in using your smartphones and checking out what mobile applications are available for this kind of work, please see the list below:
Mobile Application List with Available Features:

For more information on the Mobile Applications listed above visit the following websites:
Well, we hope you have enjoyed learning about food mapping, seeing some examples, and considering the many ways you might engage more consciously with the food system.
As you move forward with your own projects, think about how these valuable maps can help engage, explain, or improve your food environment. The communities from the maps we shared have gone on to engage local government to create bus stops and improve sidewalks for non-walkable neighborhoods to access healthy food. Other projects have incorporated their maps into grant opportunities and have been awarded monies to create restaurant and chef training programs. We encourage you to adapt and adapt these ideas as you see fit to your local community contexts.
Have fun and map away!